Friday, April 6, 2018

Unit 3 Multipliers


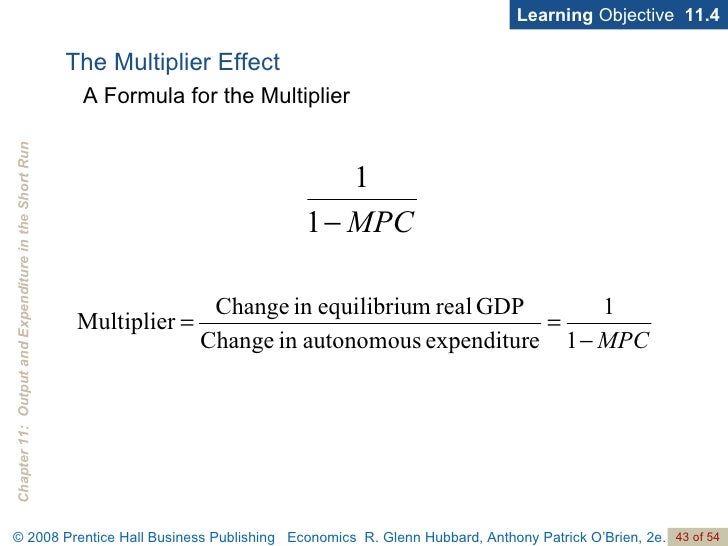
The Spending Multiplier Effect

  • An initial change in Spending (C, IG, G, Xn) causes a larger change in aggregate spending or aggregate demand. 
Image result for spending multiplier effect formula

Why does this happen?
  • Expenditures and Income flow continuously which sets off a spending increase in the economy 
Multipliers
  • Positive when there is an increase in Spening
  • Negative when there is a decrease in spending
  • When The government taxes the multipliers work in reverse (Because money is now leaving in circular flow) 
Tax Multiplier (Negative)

Image result for tax multiplier formula
  • If there is a tax-cut then the multiplier is positive because there is now more money in the circular flow 

Unit 3: Consumption and Savings


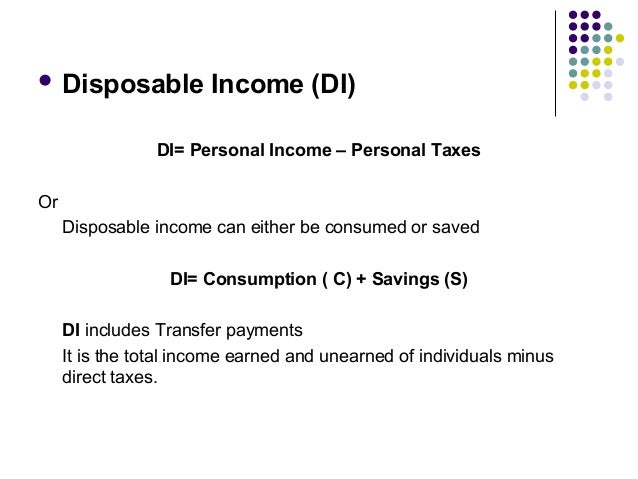
Disposable Income

  • Income After Taxes (Net Income)
Image result for formula for disposable income
There are 2 Choices

  • Consume (Spend money on goods and services)
  • Save (Not Spend money on goods and services)
Consumption

  • Household Spending 
  • Ability to consume is constrained by 
    • The amount of disposable income
    • The Propensity to Save 
Do Households consume if DI=O?

  • Autonomous Consumption
  • Dis savings 
Image result for dissavings and autonomous

Savings

  • Household NOT saving
  • The Ability to save is constrained by
    • The Amount of DI 
    • Propensity To Consume 
Do Households Save if DI=O?

Formulas
APC+APS
APC+APS=1
1-APC=APS
1-APS=APC
APC>1 (Dissaving)
-APS (Dissaving)

MPC & MPS


  • Change in C/ Change DI (% of every $ earned that is spent
MPS
  • Change in S/Change in DI 
MPC+MPS=1
1-MPS=MPC
1-MPC=MPS 

Unit 3: AD/AS

Image result for keynesian intermediate classical range

Horizontal/Keynesian Range
  • A lot of unemployed resources which creates a recession or depression. It includes only levels of Real GDP that are less than the full employment output. 
Intermediate Range
  • Resources are getting closer to the full employment level which creates pressure on wages and prices. 
Classical/Vertical Range
  • Where Real GDP is at a level with unemployment at the full employment level and where any increase in demand will result only in an increase in prices 
  • The Economy is unable to produce anymore goods and services for a sustainable period of time. 


Unit 3 Aggregate Supply


Aggregate Supply

  • The level of Real GDP (GDPr) that firms will produce at each price level. 
Image result for aggregate supply
Long Run v. Short Run

Long 
  • Period of time where input prices are completely flexible and adjust to changes in the price level 
  • In the Long Run, the level of Real GDP supplied is independently related to the price level. 
  • The Long-run aggregate supply or LRAS marks the level of full employment in the conomy
Short
  • Period of time where input prices are sticky and do not adjust to changes in the price level.
  • In the Short-Run the level of Real GDP supplied is indirectly related to the price level.
  • In the Short-Run because input prices are sticky the SRAS is upward sloping. 
  • An increase in SRAS is seen as a shift to the right 
  • A decrease in SRAS is seen as a shift to the left
  • The key to understanding shifts in SRAS is per unit cost of production 
Per-Unit Cost of Production 
  • Total Input/Total Output 
SRAS Determinants
  • Input Prices 
  • Productivity
  • Legal Institutional Environment 
Input Prices 
  • Domestic Resources Prices (Wages: 75% of all businesses) 
  • Cost of Capital 
  • Raw Materials (Commodity Prices) 
  • Foreign Resource Prices 
    • (Strong Economy= Lower Foreign Resources Prices)
    • (Weak Economy=Higher Foreign Resource Prices)
Image result for lras and sras graph

Market Power
  • Monopolies and Cartels that control resources control the prices of those resources
Increases in Resource Prices= SRAS <-----
Decreases in Resource Prices= SRAS------>

Productivity= Total Output/Total Input 
Image result for productivity formula
  • More Productivity= Lower Production Cost (SRAS ------->)
  • Lower Productivity= Higher Unit Production Cost= (SRAS<------)
Legal Institutional Environment 
  • Taxes and Subsidies
    • Taxes ($ to government) on business increase per unit production cost=SRAS<----
    • Subsidies ($ from government) to business reduce per unit production cost= SRAS--->
  • Government Regulation
    • Government Regulation creates a cost of compliance (SRAS <---)
  • Deregulation
    • Reduces compliance cost= SRAS--->


Wednesday, April 4, 2018

Unit 3: Aggregate Demand


Aggregate Demand

  • AD is the demand by consumer businesses, government and foreign nation
  • AD= C+I+G+Xn
Image result for aggregate demand

AD
  • Changes in price level cause a move along the curve not a shift in the curve. 
  • Shows the amount of real GDP that the private, public, and foreign sector collectively desire to purchase at each possible price level
  • The relationship between the price level and the level of GDPr is inverse. 

3 Reasons why AD is downward Sloping
  1. Wealth effect
  • Higher Prices reduce the dollar purchasing power.
  • This decreases the quantity of expenditures
  • Lower price levels increase purchasing power and increase expenditures 
Example
  • If the balance in your bank account was $50,000, but the inflation erodes your purchasing power you will likely reduce your spending.
  • So if price levels go up then GDP demanded goes down 
      2. Interest Rate Effect
  • As price level increases, lenders need to charge higher interest rates to get a real return on their loans. 
  • Higher interest rates discourage consumer spending and business investment.
Example
  • Increase in Price leads to an increase in the interest rate from 5% to 25%. This means you are less likely to take out loans to improve your business. 
      3. Foreign Trade Effect 
  • When U.S price level rises, foreign buyers purchase fewer goods and Americans buy more foreign goods. 
  • Exports fall and Imports rise which cause Real GDP demanded to fall (Xn Decreases) 
Example
  • If prices triple in the U.S, Canada will no longer buy U.S goods causing quantity demanded of products to fall. 
Shifts in AD (Two Parts) 
  • A change in C, IG, G, and or Xn 
  • A multiplier effect that produces a greater change than the original change in components.
  • Increase in AD= AD--->
  • Decrease in AD= AD<------
Image result for increase in aggregate demand


Image result for decrease in aggregate demand

Determinants of AD 
  • Consumption
  • Gross Private Investment 
  • Government Spending 
  • Net Exports (Xn)= Exports-Imports 
Change in Consumer Spending 
  • Consumer wealth (Boom in the stock Market)
  • Consumer Expectations (People fear a recession)
  • Household in debetness (More consumer dept) 
  • Taxes (Decrease in income Taxes) 
Changes in Investment Spending
  • Real Interest Rate (Price of borrowing $) 
  • If interest Rate Increases 
  • If interest decreases
  • Future Business Expectations (High Expectations) 
  • Productivity and Technology (New Robots) 
  • Business Taxes (Higher corporate taxes) 
Change in Government Spending
  • War 
  • Nationalized Health Care 
  • Decrease in Defense Spending
Change in Net Exports (Xn) 
  • Exchange Rates 
  • If the U.S $ depreciates relative to the euro. 
National Income Compared to abroad 
  • If a major importer has a recession
  • If the U.S has a recession 
IF THE U.S GETS A COLD, CANADA GETS PNEUMONIA 
AD=GDP

Government Spending
  • More Government Spending: AD----->
  • Less Government Spending: AD<------

Unit 7: Balance of Payments, Foreign Exchange, Comparitive and Absolute Advantage

  Balance of Payment   Measure of money inflows and outflows between the united states and the rest of the world . Inflows are ref...